Profiling in python
Yesterday, I was watching a twitch stream and saw profiling in python for the first time. I wanted to try it out myself. In this post I’m sharing my learnings on profiling.
Let’s us first try to understand what does profiling mean?
Profiling is a dynamic program analysis that helps us in understanding how much is allocated, consumed, free, garbage collected or how much time is spent in different regions of the code.
Here are the steps I followed:
Step1: Write a python script. To give an overview, I have written a main function where I’ve written a few print statements and after that calling few functions. In this script there are few functions that doesn’t depict any functionality or operation (dummy functions). In order to create time intensive function I’m using time.sleep inside calling_nested_function_time_taking function. There is another function called function_call_will_happen implementing for loop. Apart from this we are creating a file and writing some content in it since IO operation could be time consuming (we will check with our profiling results). At last I’m making few network calls using requests module. This is all about the code below.
import time
import os
import sys
import traceback
import requests


def calling_nested_function_time_taking():
    print('Inside most time consuming function')
    time.sleep(60)  # 1 min sleep
    sys.getprofile()


def this_function_will_not_call():
    print('this function is not called')


def function_call_will_happen():
    print('printing function call')
    for i in range(100000000):
        pass

    print('function call is over')
    calling_nested_function_time_taking()
    test_function()


def test_function():
    for i in range(100):
        pass

    if True:
        file = open('test_file.txt', 'a+')
        file.write('Hello, World!\nThis is a test file to learn profiling')
        file.close()

    try:
        raise Exception('this is a new exception for testing purpose')
    except:
        print('handling tracebak')
        traceback.print_stack()


def call_random_activity():
    try:
        r = requests.get('https://google.com')
        r = requests.get('https://facebook.com')
        r = requests.get('https://twitter.com')
        r = requests.get('https://microsoft.com')
        r = requests.get('https://twittch.com')
        r = requests.get('https://github.com')
        r = requests.get('https://netflix.com')
    finally:
        pass
    if r.status_code == 200:
        file_remove()


def file_exists():
    return os.path.isfile('./test_file.txt')


def file_remove():
    print('removing file')
    if file_exists():
        os.remove('test_file.txt')


def done_with_code():
    pass


def main():
    print("Hello, World")
    print(os.getcwd())
    print(os.getenv('SHELL'))
    if False:
        this_function_will_not_call()
    else:
        function_call_will_happen()

    call_random_activity()
    file_remove()
    done_with_code()


if __name__ == '__main__':
    main()
Step2: Choose a profiler
As per python docs I went ahead wit the cProfile and ran the below command:
python3 -m cProfile -o output.pstats main.py
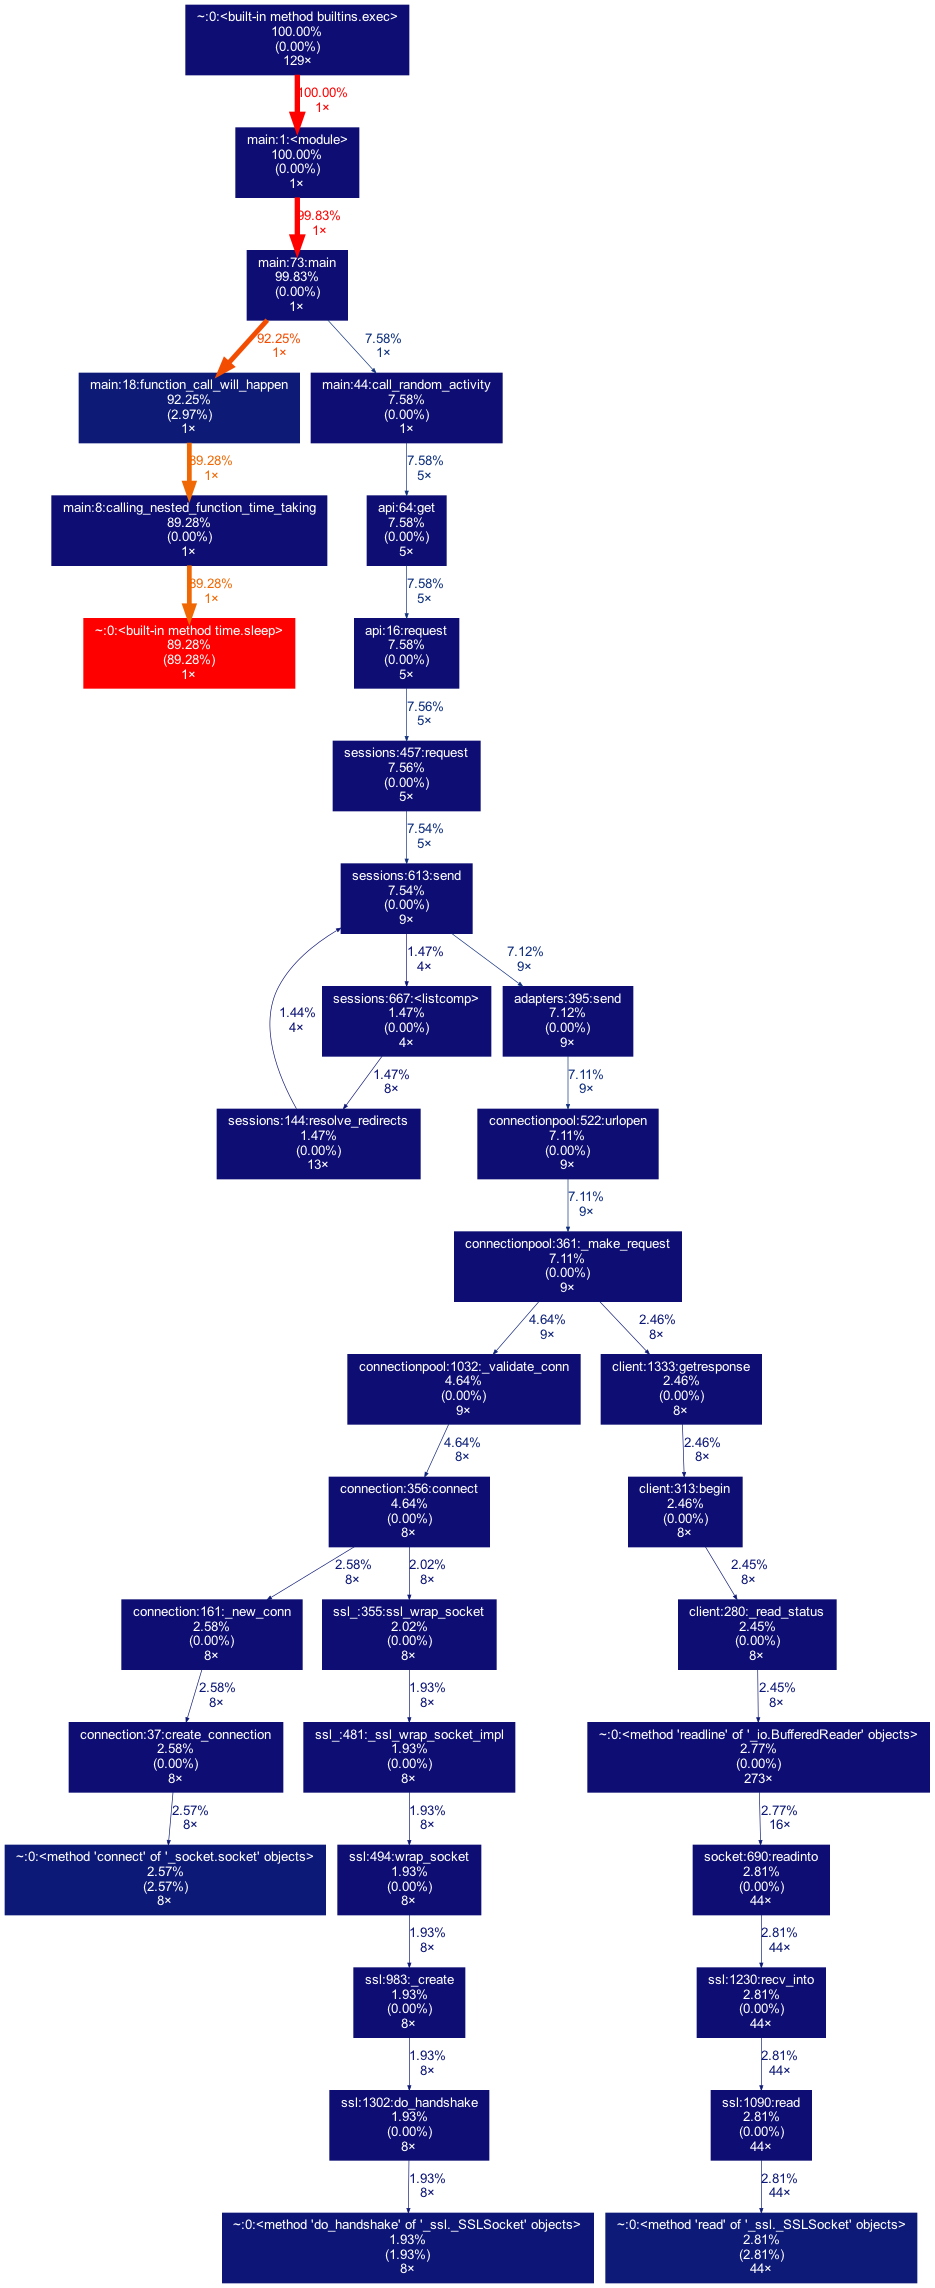
Running this command will create an output.pstats file that will have all the metrics. It was difficult to read output.pstats file. After looking on the internet I found a great visualizer that will convert output.pstats file into PNG/SVG format in the form of flowchart as shown in the screenshot.
Click here to display output.png
To get the above image I installed gprof2dot and ran
gprof2dot -f pstats output.pstats | dot -Tpng -o output.png
Step3: How to read the above image output?
- Each box represents a function from the input file.
- The very first percentage tells us total run time spent on this function. This is the overall time including other functions that are called by this function.
- percentage in brackets shows the total run time spent on this function only.
- third metrics tell us the number of time function is called.
- Boxes in the red color are the ones which are taking most of the time.
- Blue boxes depict functions that look less time.
Step4: What to look for?
As seen in the output image. Function with red coloring is taking time. time.sleep function is taking time. Usually you don’t want to change code from external libraries, but you can see which of your functions call an external library function by going back along the arrow from that function. You might be able to optimise the way your code calls the external function, use a more optimised library, or remove the call entirely.
Outro
Indeed, learning profiling in python was completely new to me and I hope I can use this in the projects. I hope you also find it useful ^_^