How I Learned to Read EXPLAIN ANALYZE (and Stopped Guessing)
How I Learned to Read EXPLAIN ANALYZE (and Stopped Guessing)
For a long time, I treated slow SQL queries like a bad fever.
I’d add an index, pray a little, deploy, and hope latency graphs went down.
Sometimes they did.
Most times they didn’t.
This is the story of how one query — and one EXPLAIN ANALYZE output — changed how I debug databases forever.
The Incident
It was a normal weekday.
Dashboards were green. Coffee was hot. Life was good.
Then a message dropped in Slack:
“Checkout page is slow. 3–5s. Users dropping.”
The query looked innocent:
SELECT u.id, u.name, SUM(o.amount) AS total_spent
FROM users u
JOIN orders o ON u.id = o.user_id
WHERE u.country = 'US'
  AND o.status = 'completed'
  AND o.created_at > now() - interval '30 days'
GROUP BY u.id, u.name
ORDER BY total_spent DESC
LIMIT 5;
It worked fine in staging.
It worked fine last week.
But production had grown — and the database was now angry.
Stop Guessing. Start Observing.
I ran the one command I used to avoid:
EXPLAIN ANALYZE
And this appeared:
Parallel Seq Scan on orders
(actual time=0.021..156.678 rows=28834 loops=2)
Rows Removed by Filter: 471166
That single line explained the entire slowdown.
PostgreSQL was scanning half a million rows
to find 28k useful ones.
Read the Plan Like a Story (Bottom → Top)
Execution plans are stories, not walls of text.
- The Seq Scan was the villain
- The Hash Join was doing its job
- The Aggregate was tired but necessary
- The Sort was actually optimized (top-N heapsort)
The real problem was obvious:
I wasn’t helping the planner.
Fix the Root Cause, Not the Symptom
I didn’t cache.
I didn’t add replicas.
I didn’t scale the database.
I added one intentional index:
CREATE INDEX idx_orders_completed_recent
ON orders (created_at, user_id)
WHERE status = 'completed';
A partial index.
Small. Focused. Purpose-built.
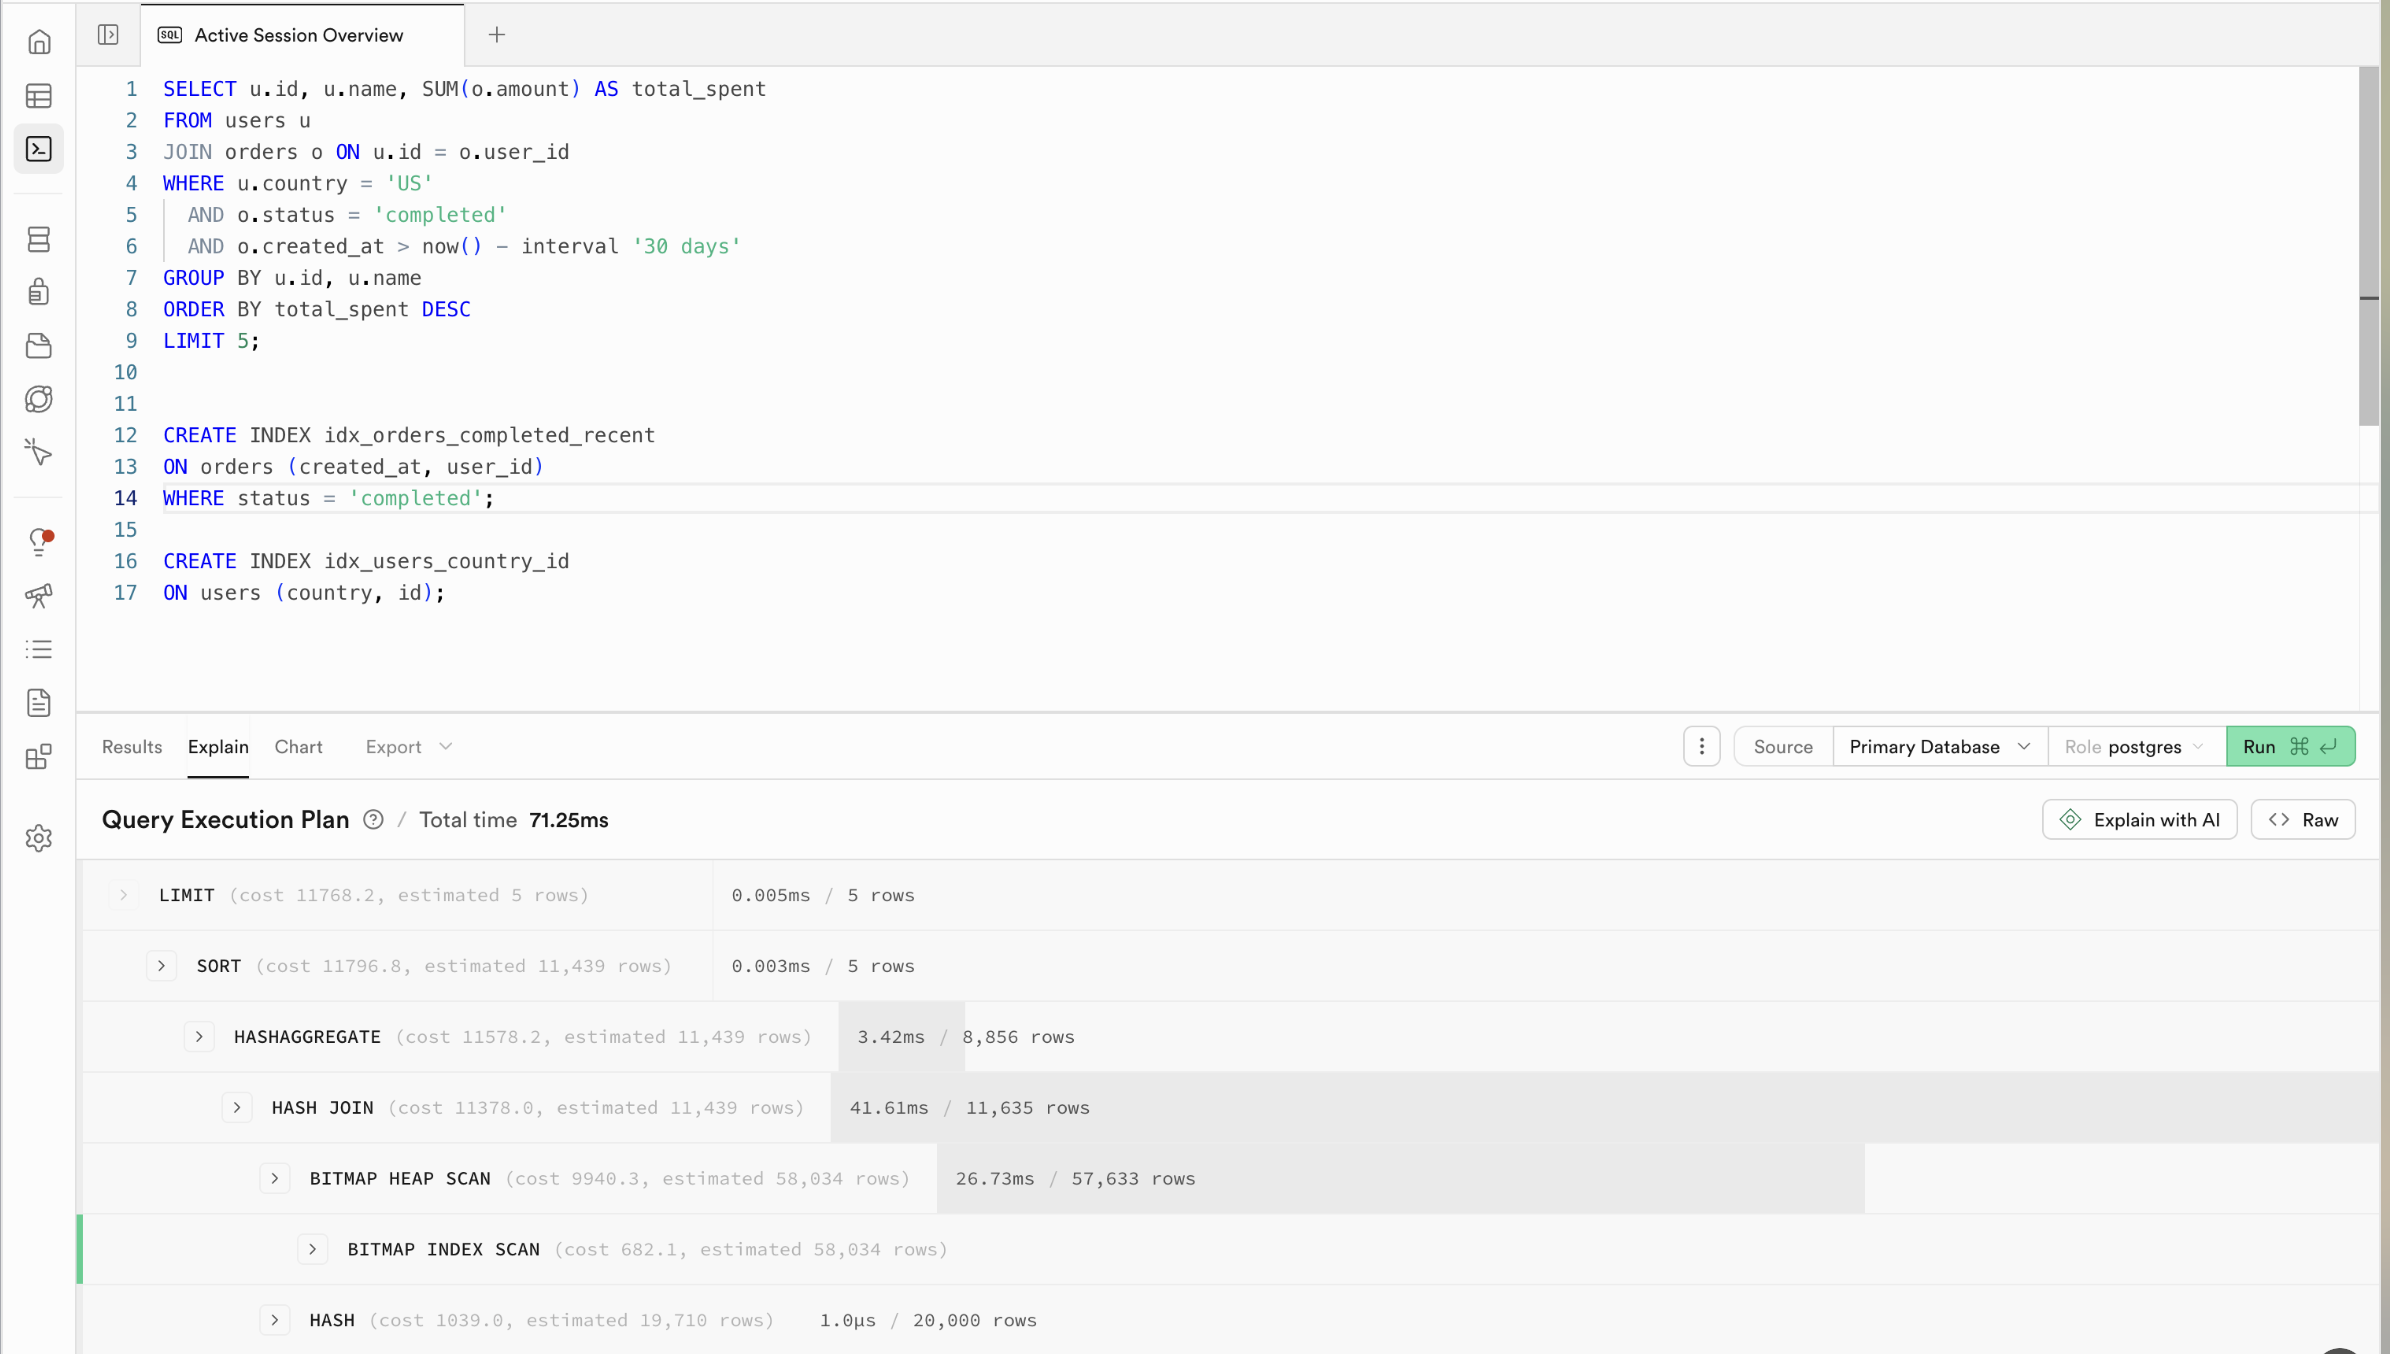
Rerun EXPLAIN ANALYZE (The Moment of Truth)
The plan changed instantly:
Index Scan using idx_orders_completed_recent
(actual time=0.2..8ms)
Execution time dropped from:
210ms → 71.25ms
No infra changes.
No rewrites.
Just understanding.
The Lesson
Before this, I believed:
“Slow queries need more resources.”
Now I know:
“Slow queries need better plans.”
EXPLAIN ANALYZE isn’t just a debugging tool —
it’s a conversation with your database.
Final Thought
The day I learned to read EXPLAIN ANALYZE
was the day I stopped being afraid of databases.
If you can read the plan,
you can fix the problem.
Every time.